Introduction -
In a programming language such as C, memory allocation and deallocation is a manual process and in the long run can become a tedious task for developers.
On the other hand, Java has an in-built Memory management system in which the process of deallocating memory is handled automatically by the Garbage Collector. This allows Developers to code without worrying explicitly about memory allocation and deallocation because the Garbage Collector reclaims the memory for reuse.
Garbage Collection in Java -
In Java, there are basically two areas of memory -
- Stack - where method invocations and local variables live.
- Heap - where objects live.
Garbage Collector basically governs the Heap.
In Java, Garbage Collection is the process of analyzing the Heap memory, identifying which objects are in use and which are not, and deleting the unused objects.
Now the question arises how is the usefulness / uselessness of an object decided. So the general rule of thumb says that, as long as an object is being referenced, the JVM (Java Virtual Machine) considers it alive and useful; once an object is no longer referenced the JVM considers it as useless and marks it eligible for Garbage collection.
It is a general misconception that the Garbage Collector collects and discards dead objects. But in reality, the Garbage Collector does the opposite by tracking the Live objects and marking everything else as garbage.
Avoiding the Pitfall -
Despite the state of the art Memory management system of Java, it is sometimes possible for Java Applications to suffer from Memory leak issues which can be caused by a number of reasons.
One of them being, a Logical Memory Leak. It is a case wherein unused objects are still holding references and are still reachable by an Application because the developer simply forgot to dereference them. Such objects cannot be garbage-collected.
So developers must pay special attention to analyze their code and confirm that their code doesn’t suffer from a Logical Memory Leak. (A visual tool to help in the analysis is described later)
Tools for monitoring JVM -
The JDK provides a number of tools for monitoring the JVM like “Java Management & Monitoring Console”, “Java VisualVM” etc.
Those tools can be accessed using the Executables in the bin folder of your jdk. If the JAVA_HOME is set then these tools can be accessed directly by executing the necessary commands in the terminal.
Example - command “jconsole” for Java Management & Monitoring Console and “jvisualvm” for Java VisualVM. (We will see a working example of Java VisualVM shortly.)
Garbage Collection in Action -
- We will first write a sample program (Console Application) in which we create 2 Objects, then derefer one of them unconditionally and the other one conditionally.
- We will use the “Java VisualVM” to analyze the objects on the heap at each stage.
1) The Sample program
 |
| fig. 1. Sample program for demonstrating dereferencing of objects. |
Run the above Sample console application.
The Application will keep on running due to the while loop until we stop it.
As you can observe above the object “lobjTestClass1” is dereferred directly by setting it to null and the object “lobjTestClass2” is dereferred conditionally only when user enters “delete” in the console.
Note -
The Classes “TestClass1” and “TestClass2” are sample classes without anything in them.
2) Heap Analysis
2.1 Open “Java VisualVM” from Terminal using jvisualvm command
 |
| fig. 2. Type jvisualvm command in Terminal (The Terminal shown is a Ubuntu Linux Terminal. Same command can be used in command prompt in Windows) |
If the JAVA_HOME is set then we can directly execute the command as show above.
If JAVA_HOME is not set then we can browse to the bin folder of jdk and execute the jvisualvm executable
2.2 Analysis using Java VisualVM
2.2.1 Once the Java VisualVM Tool is opened Double Click the name of the Java Application in the Applications Tab as shown.
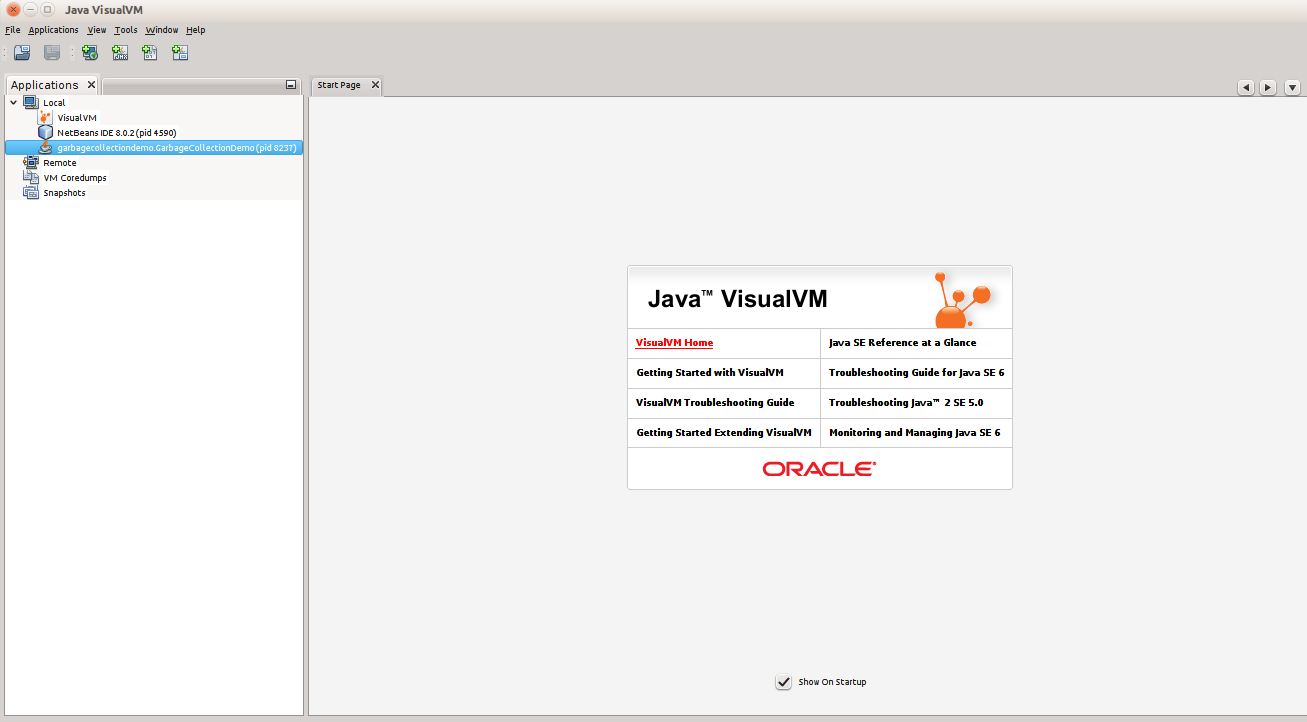 |
| fig. 3. Select the Java application in Applications Tab. |
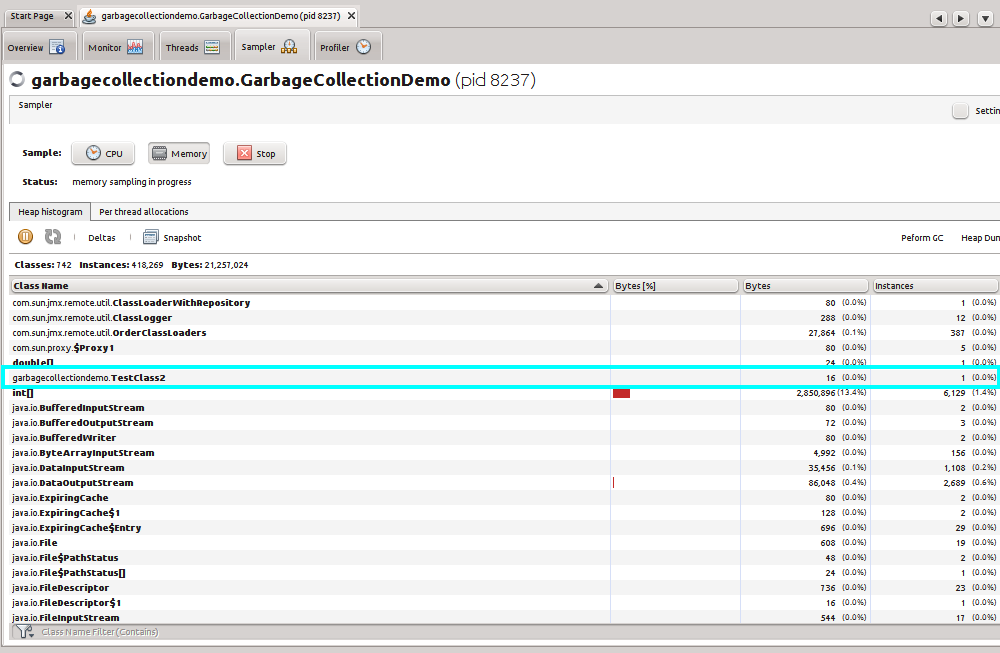
2.2.2 Select the Sampler Tab and Click the Memory button
 |
| fig. 4. In the Sampler Tab click the Memory Button to get the Heap Histogram. |
To find out the required objects quickly sort the Heap histogram on Class Name column.
As seen in the Heap histogram, the object “lobjTestClass1” of Class TestClass1 and the object “lobjTestClass2” of Class TestClass2 can be seen as highlighted above. (Note - We actually cannot see the variable name here but can see the Class name and the number of instances as 1)
2.2.3 Perform Garbage Collection explicitly.
Click on the “Perform GC” button to enforce Garbage Collection.
Once Garbage Collection is done the object “lobjTestClass1” of Class TestClass1 will disappear from the Heap histogram.
 |
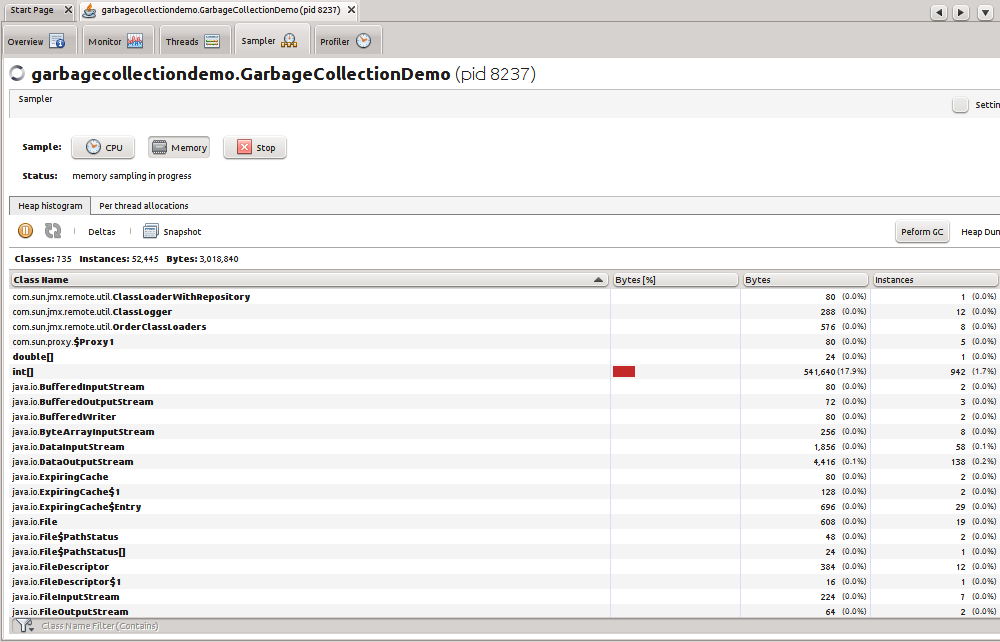
| fig. 5. Object of Class TestClass1 has disappeared from the Heap Histogram. |
As seen in the Heap histogram, the object “lobjTestClass1” of Class TestClass1 is not seen since it was dereferenced in the Sample program and hence garbage collected by the JVM.
On the other hand, the object “lobjTestClass2” of Class TestClass2 is still on the heap (since it is not dereferred yet) and can be seen as highlighted above.
2.2.4 Enter “delete” in the Application Console
This will derefer the object “lobjTestClass2” of Class TestClass2 since we have set the variable “lobjTestClass2” to null.
Since the variable “lobjTestClass2” is set to null the object on the heap becomes orphan and eligible for Garbage collection.
2.2.5 Again Perform Garbage Collection explicitly.
Once again click on the “Perform GC” button to enforce Garbage Collection.
 |
| fig. 6. Object of Class TestClass2 has also disappeared from the Heap Histogram. |
As seen in the Heap histogram, the object “lobjTestClass2” of Class TestClass2 is not seen since it was dereferenced in the Sample program and hence garbage collected by the JVM.
Conclusion -
To conclude, we have seen an overview of Garbage Collection in Java, some possible pitfalls, a way for dereferencing objects and a way to visualize and analyse the heap.
Hope this will help you in writing memory efficient Java programs.
No comments:
Post a Comment
Enter ur comments