In my previous article, we had seen a method for analyzing the Heap so as to avoid memory leakage. In this article, we will discuss a methodology for Thread Analysis.
But if two or more threads utilize the same resources then a conflict between the threads is inevitable.Thread conflict occurs when a thread is waiting for a lock, held by another thread to be lifted.
A Special type of Thread conflict is a “Deadlock” wherein two or more threads are waiting for other threads to complete their tasks in order to complete their own tasks.
To analyze such issues it is important to know the Thread Status of each and every Thread.
Also in case of an application employing waits and synchronization and facing with random issues like unresponsiveness, slow processing, etc. proper Thread Analysis can help to track the root cause.
We will now see a methodology for Thread analysis using jvisualvm.
As seen above we have implemented a wait on the lobjSynchronizer object in TestClass. Notice the wait is inside a synchronized block so that only one thread can access the code in the synchronized block at a time.
At the same time we have initiated a separate thread to accept an input from the user and if it is “Y” then we notify the lobjSynchronizer object in a synchronized block due to the reason mentioned earlier.
Class - ThreadMonitorDemo
Before Wait.
Enter ‘Y’ to Resume.
This is a State where one Thread (Thread-0 as shown in image below) is in the waiting state and another thread is ready to accept the input from the User.This can be observed in the Java VisualVM tool as shown below.
Thread-0 with the Yellow timeline is the Thread which has encountered the wait on the lobjSynchronizer object in TestClass.
Thread-1 with the Green timeline is the Thread which is ready to accept an input from the User.
The print statement after wait is also printed on the console and now it is executing a while loop after Wait.
Also notice that the Thread-1’s timeline has transformed from Green to White which means it has completed it’s task (since the inline thread has no task after notifying the lobjSynchronizer object)
Hope this will help you in Thread analysis of Java programs.
Introduction -
A Multithreaded Java Application handling a large number of Concurrent Users needs to be designed and implemented carefully so as to use the maximum resources available and to reduce the response time for each and every User. By maximum resources, I mean maximum CPU power available at disposal.Also in case of an application employing waits and synchronization and facing with random issues like unresponsiveness, slow processing, etc. proper Thread Analysis can help to track the root cause.
Thread Analysis Use case-
- We will first write a sample program (Console Application) in which we will implement a wait on a thread.
- We will then run the program and use the Tool jvisualvm to visualize the thread.
1) The Sample program
Class - TestClass
 |
| fig. 1. A Sample Class implementing a wait and notify. |
As seen above we have implemented a wait on the lobjSynchronizer object in TestClass. Notice the wait is inside a synchronized block so that only one thread can access the code in the synchronized block at a time.
At the same time we have initiated a separate thread to accept an input from the user and if it is “Y” then we notify the lobjSynchronizer object in a synchronized block due to the reason mentioned earlier.
 |
| fig. 2. A Sample Class with main starting TestClass on a new Thread |
2) Run the program and start the jvisualvm tool as explained in the earlier post.
2.1 Before Wait
On running the program the console will display a message -Before Wait.
Enter ‘Y’ to Resume.
This is a State where one Thread (Thread-0 as shown in image below) is in the waiting state and another thread is ready to accept the input from the User.This can be observed in the Java VisualVM tool as shown below.
 |
| fig. 3. Java VisualVM tool snapshot showing Thread-0 in Wait state and Thread-1 in Running State. |
Different Thread States as shown in the Tool :
The Thread tab shows a list of live and finished threads. Colors are used to distinguish between different thread states.
- Running: thread is still running
- Sleeping: thread is sleeping (method yield() was called on the thread object)
- Wait: thread was blocked by a mutex or a barrier, and is waiting for another thread to release the lock
- Park: parked threads are suspended until they are given a permit. Unparking a thread is usually done by calling method unpark() on the thread object
- Monitor: threads are waiting on a condition to become true to resume execution
The Wait on Thread-0 can also be analysed and seen using the ThreadDump as shown below. (Note to get the Thread Dump click the Thread Dump button in the top right corner of the Threads tab)
 |
| fig. 4. Java VisualVM Thread Dump showing Thread-0 in Wait state at line 26 in Testclass.java. |
2.2 After Wait
Now enter “Y” in the console so that the lobjSynchronizer object is notified and the wait on Thread-0 is lifted.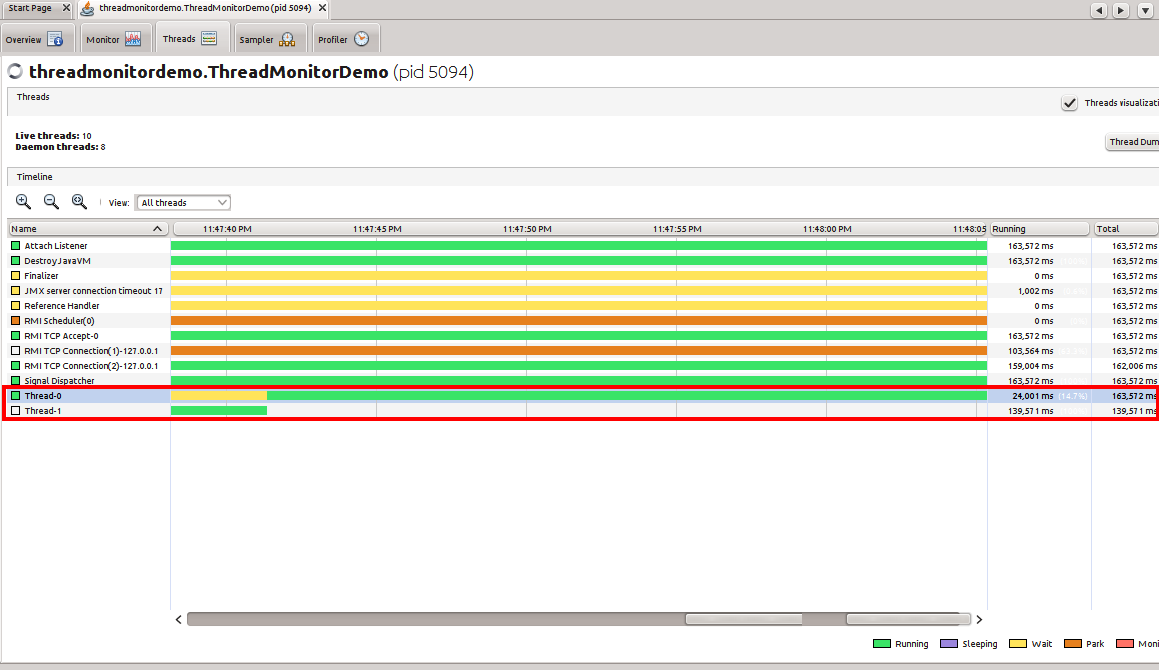 |
| fig. 5. Java VisualVM tool snapshot showing Thread-0’s transformation from Wait state to Running State and Thread-1 completing it’s task. |
As seen above the Thread-0’s timeline has transformed from Yellow to Green which means it is now in a running state.
The print statement after wait is also printed on the console and now it is executing a while loop after Wait.
Also notice that the Thread-1’s timeline has transformed from Green to White which means it has completed it’s task (since the inline thread has no task after notifying the lobjSynchronizer object)
Conclusion -
Thread Analysis is an important part of Java Application Development and Java VisualVm provides an effective graphical way for the same.